Network Monitoring Systems
Introduction
Section titled “Introduction”TestCLIX provides an API that allows integration with network monitoring systems. This enables you to trigger test scenarios and retrieve their results directly from your monitoring dashboard, giving you a unified view of your infrastructure and website health.
Network monitoring tools typically support HTTP-based sensors that can query external APIs on a schedule. By pointing such a sensor at the TestCLIX API, you can incorporate website testing results into your existing monitoring workflows - including alerting, reporting, and escalation.
In this guide, we use PRTG Network Monitor as a reference implementation, but the same approach applies to any monitoring system that supports custom HTTP sensors (e.g., Zabbix, Nagios, Datadog, Checkmk, or similar).
Integration
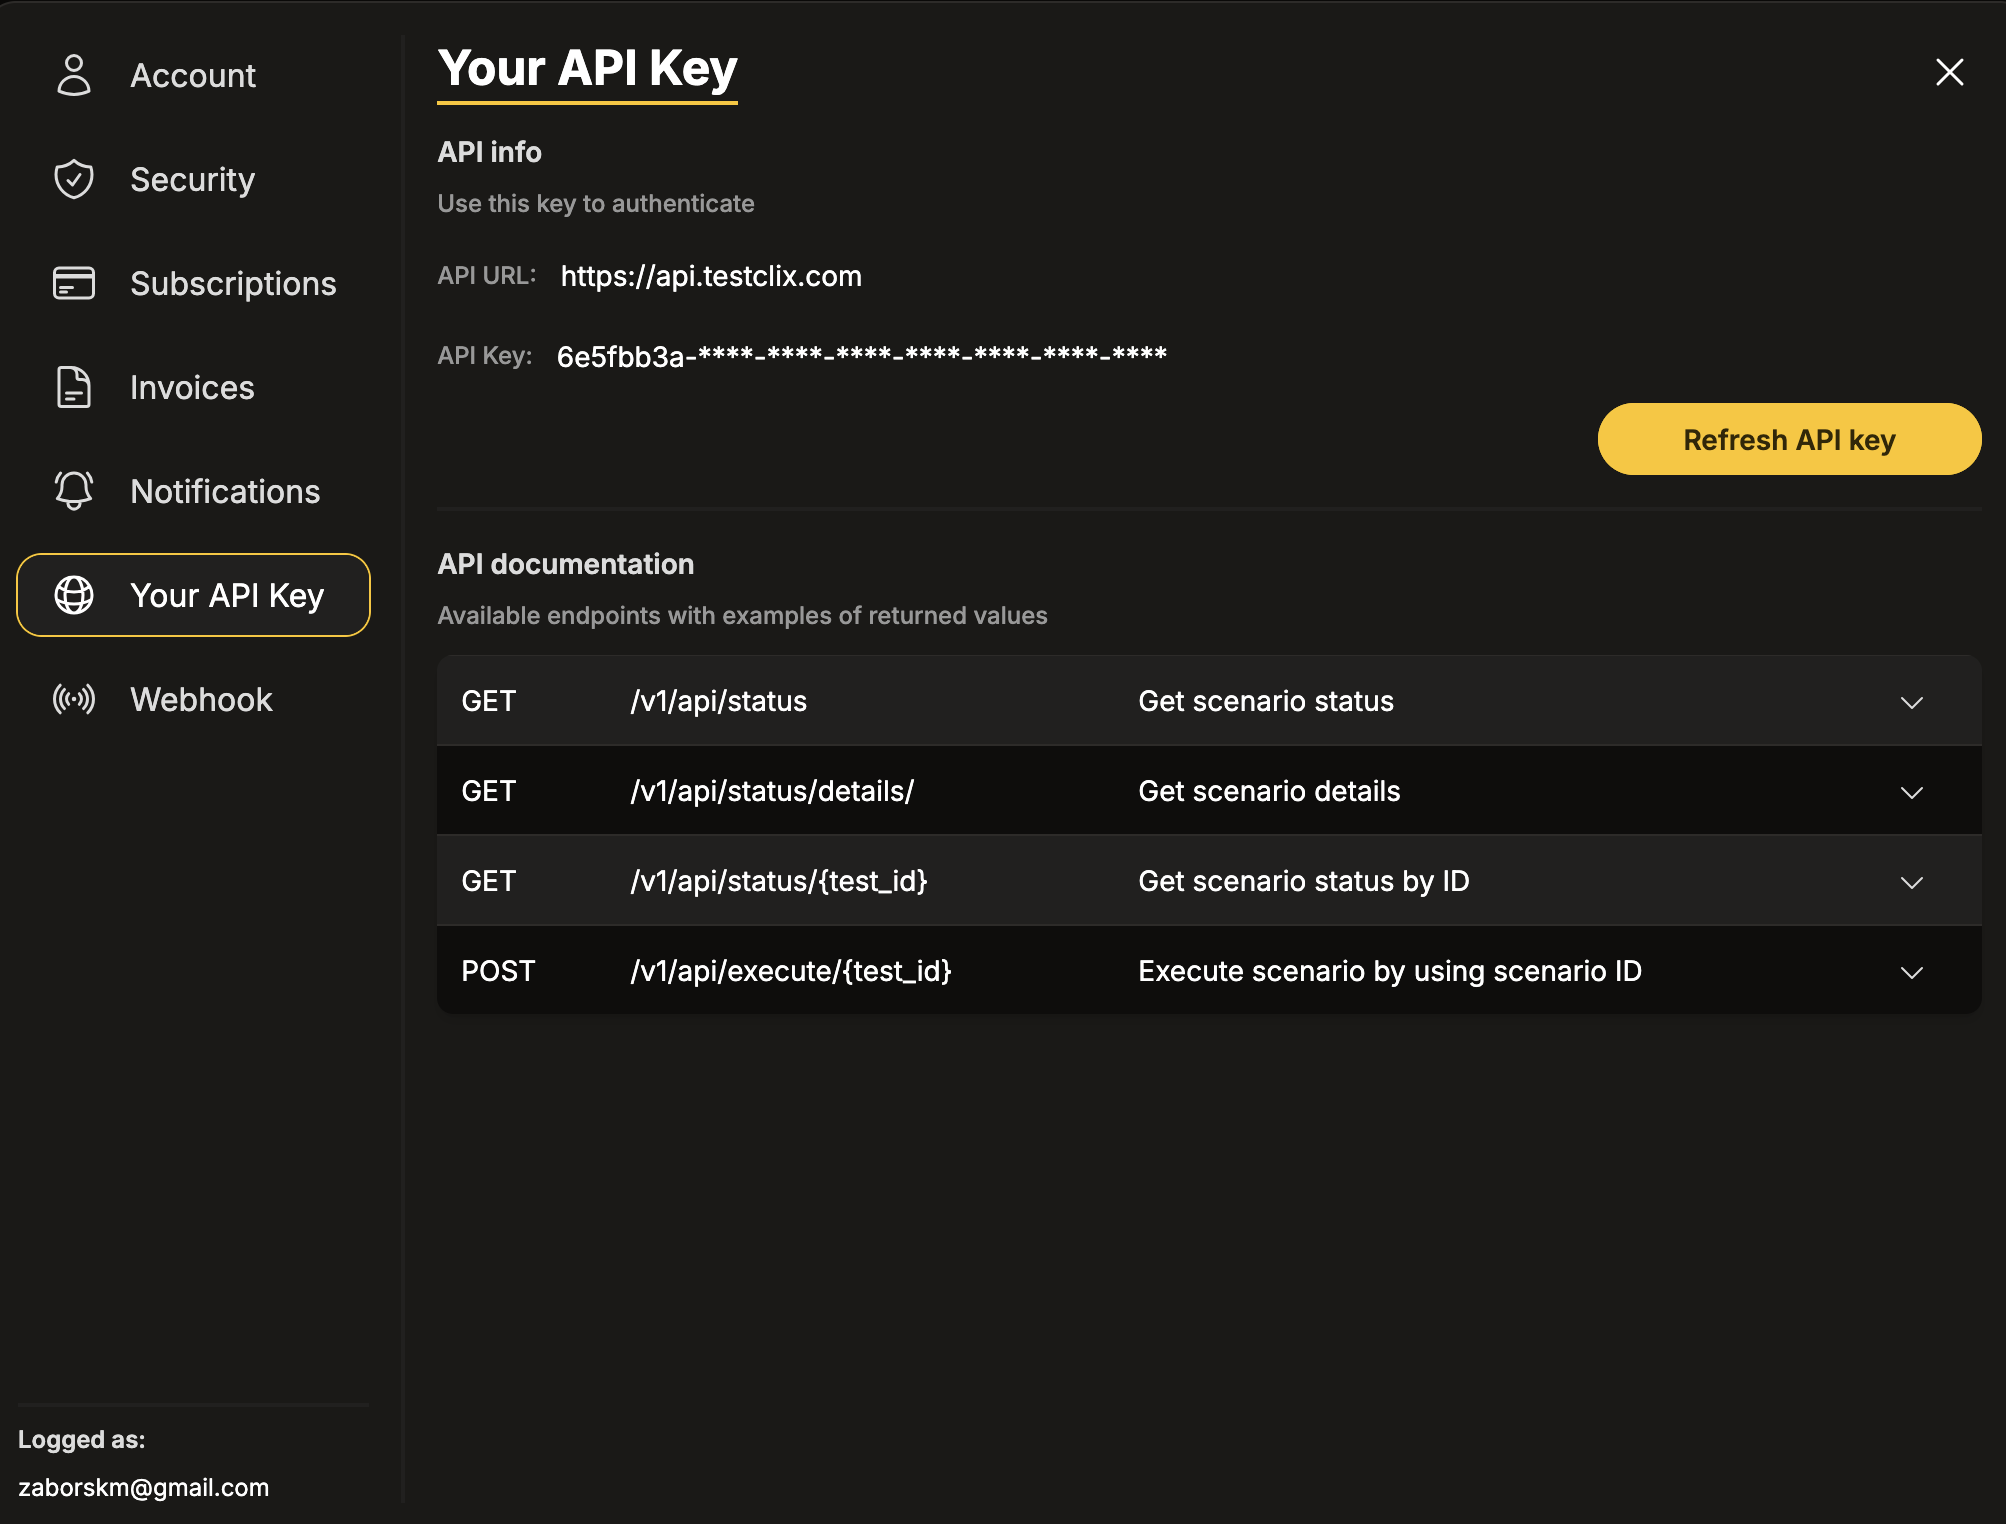
Section titled “Integration”Step 1: Generate Your API Key
Section titled “Step 1: Generate Your API Key”-
Open Settings from the left sidebar menu.
-
Navigate to the Your API Key section.
-
Click the Generate API Key button.
-
Once the key appears, click Save to store it.
Step 2: Identify the Test Scenario ID
Section titled “Step 2: Identify the Test Scenario ID”-
Navigate to your Workspace using the left sidebar menu.
-
Click on the specific test scenario you want to monitor.
-
In the scenario details panel, locate and copy the ID field.
Step 3: Configure the Sensor in Your Monitoring System
Section titled “Step 3: Configure the Sensor in Your Monitoring System”The general approach is to create an HTTP sensor that queries the TestCLIX status API endpoint.
API Endpoint:
https://testapi.testclix.com/v1/api/status/{YOUR_SCENARIO_ID}Replace {YOUR_SCENARIO_ID} with the ID you copied in Step 2.
Example:
curl https://testapi.testclix.com/v1/api/status/{YOUR_SCENARIO_ID} -H "x-api-key: {YOUR_API_KEY}"Required HTTP configuration:
| Setting | Value |
|---|---|
| Request Method | GET |
| URL | https://testapi.testclix.com/v1/api/status/{ID} |
| Custom Headers | x-api-key: {YOUR_API_KEY} and Content-Type: application/json |
Below is a reference walkthrough using PRTG Network Monitor. Adapt the steps to match the interface of your monitoring tool.
-
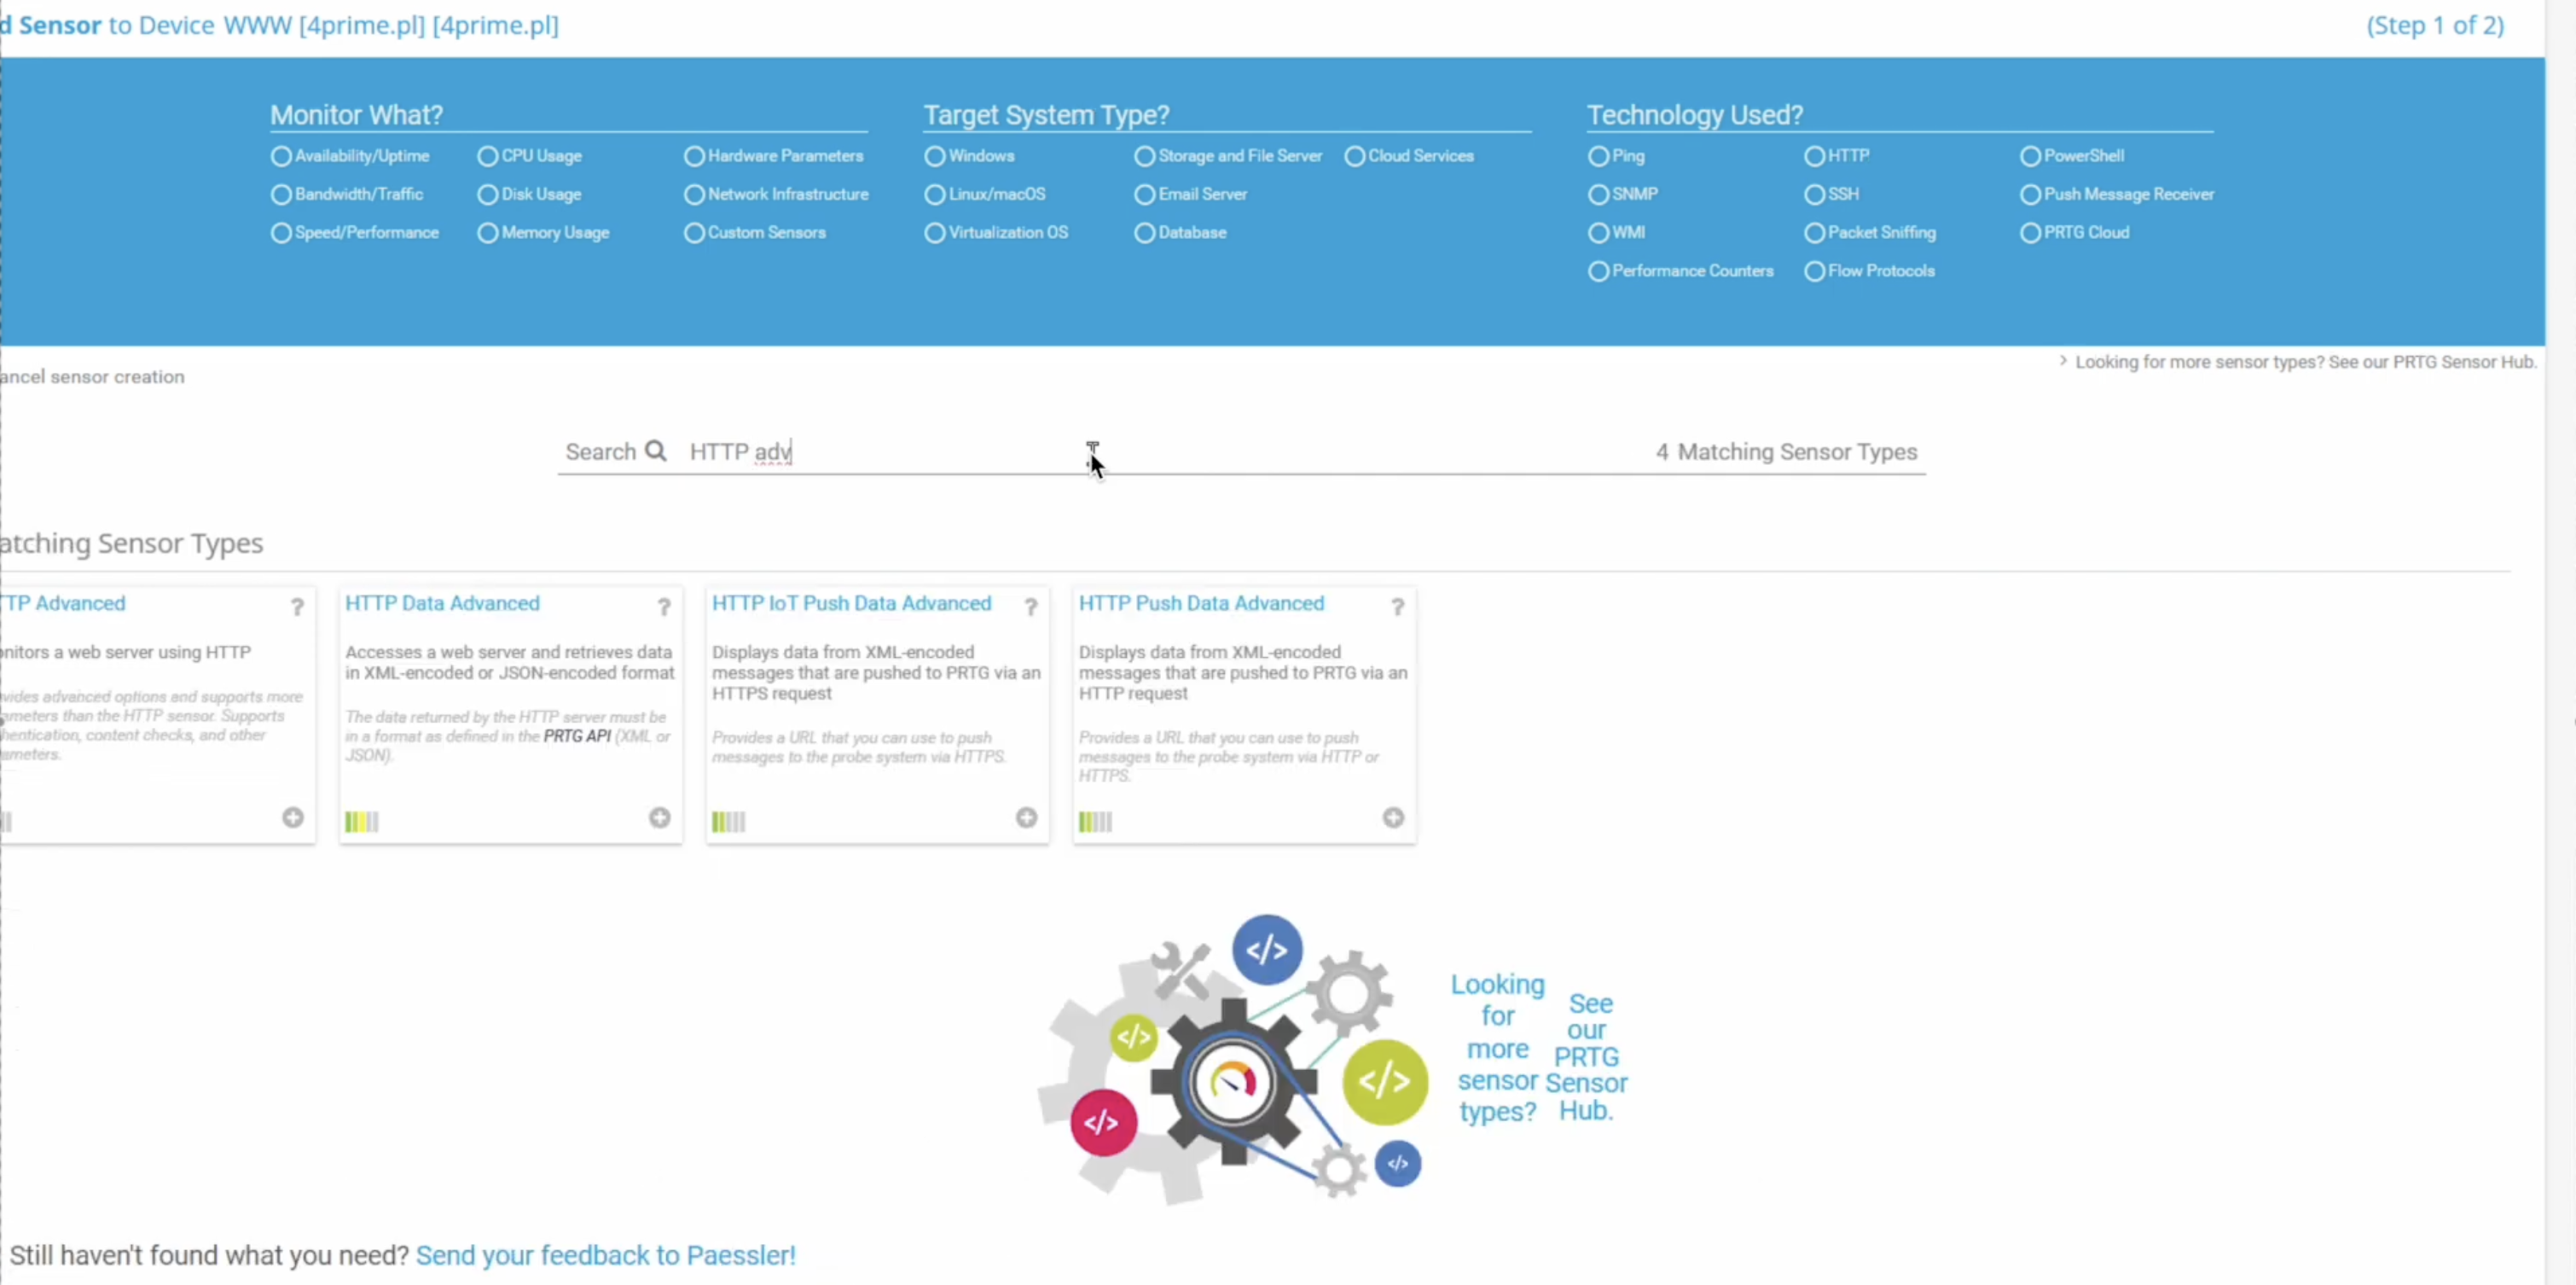
In your PRTG dashboard, click Add Sensor under the desired device.
-
Search for HTTP and select the HTTP Advanced sensor type.
-
In the sensor settings, paste the TestCLIX API endpoint URL into the URL field:
https://testapi.testclix.com/v1/api/status/{YOUR_SCENARIO_ID} -
Scroll down to the HTTP Specific settings:
- Set the Request Method to
GET. - In the HTTP Headers section, select Use custom HTTP headers.
- Add
x-api-key: {YOUR_API_KEY}and setContent-Typetoapplication/json.
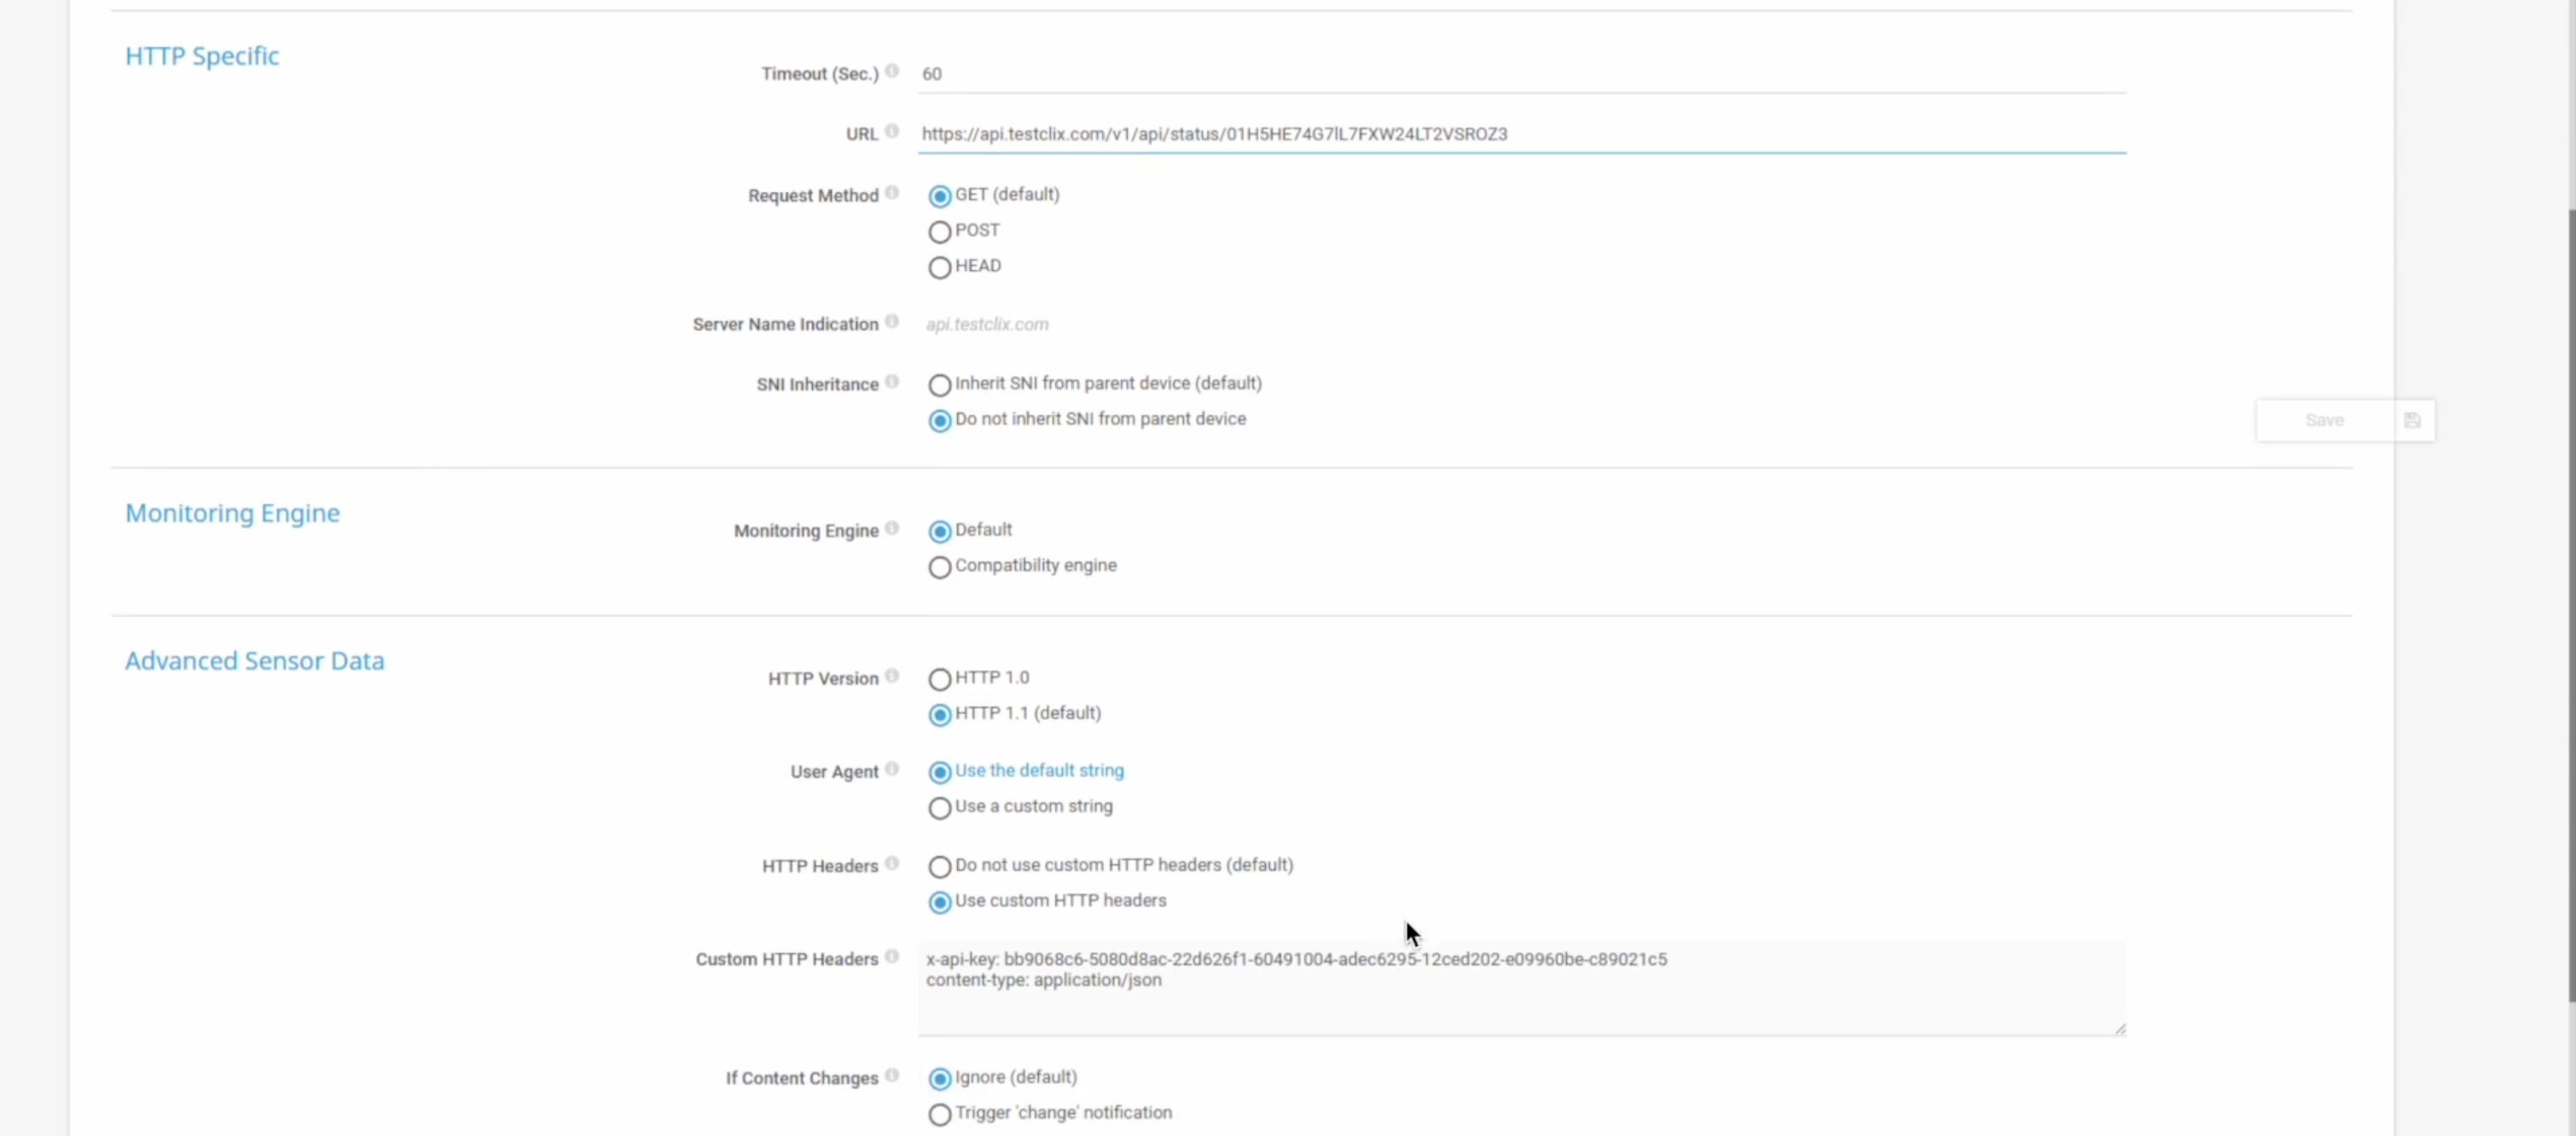
- Set the Request Method to
-
Save the sensor settings to begin monitoring.
For other monitoring systems, the general steps are:
-
Create a new HTTP or REST API sensor/check in your monitoring tool.
-
Configure it to send a
GETrequest to:https://testapi.testclix.com/v1/api/status/{YOUR_SCENARIO_ID} -
Add custom HTTP headers:
x-api-key: {YOUR_API_KEY}andContent-Type: application/json. -
Configure your monitoring tool to interpret the API response and map the test status to your alerting rules.
-
Save and activate the sensor.
Once configured, your monitoring system will query TestCLIX on its regular polling schedule and report the pass/fail status of your test scenarios alongside the rest of your infrastructure monitoring.
Hands-on
Section titled “Hands-on”Sometimes seeing something is more important than reading. We invite you to watch a step-by-step introductory video that highlights this integration: