Metrics
Introduction
Section titled “Introduction”Web performance directly affects user experience, search engine rankings, and conversion rates. Slow pages frustrate visitors, and even small regressions in loading speed or visual stability can have a measurable impact on business metrics.
TestCLIX measures a set of industry-standard performance metrics — commonly known as Web Vitals — alongside Lighthouse audit scores. Together, these give you a clear picture of how your website performs from a real browser running in the cloud.
When a vitals test runs, TestCLIX loads the configured URL in a real browser environment and collects the following metrics. Each metric is compared against a configurable threshold. If any metric falls below its threshold, the test fails.
Core Web Vitals
Section titled “Core Web Vitals”LCP — Largest Contentful Paint
Section titled “LCP — Largest Contentful Paint”Measures how long it takes for the largest visible element (image, heading, text block) to render on the page. A high LCP means users stare at a blank or incomplete screen for too long.
Threshold unit: milliseconds.
CLS — Cumulative Layout Shift
Section titled “CLS — Cumulative Layout Shift”Measures how much the page layout shifts unexpectedly during loading. Elements that move around after appearing — such as buttons pushed down by a late-loading banner — cause poor user experience and accidental clicks.
Threshold unit: score (unitless, lower is better).
TBT — Total Blocking Time
Section titled “TBT — Total Blocking Time”Measures the total time the main thread is blocked by long-running JavaScript tasks between first paint and full interactivity. High TBT means the page appears loaded but does not respond to clicks or keyboard input.
Threshold unit: milliseconds.
TTI — Time to Interactive
Section titled “TTI — Time to Interactive”Measures how long it takes for the page to become fully interactive — meaning the page has rendered useful content and is reliably responsive to user input.
Threshold unit: milliseconds.
Performance Score
Section titled “Performance Score”Lighthouse Performance score summarizes loading and responsiveness quality. It reflects weighted signals from page speed metrics and ranges from 0 to 100.
Threshold unit: score (0–100).
Accessibility Score
Section titled “Accessibility Score”Lighthouse Accessibility score checks whether the page is usable for people with disabilities (for example semantic structure, labels, and contrast). The score ranges from 0 to 100.
Threshold unit: score (0–100).
Best Practices Score
Section titled “Best Practices Score”Lighthouse Best Practices score evaluates modern web quality and safety checks such as secure transport, API usage, and implementation hygiene. The score ranges from 0 to 100.
Threshold unit: score (0–100).
SEO Score
Section titled “SEO Score”Lighthouse SEO score validates baseline search optimization signals such as metadata quality and crawlability. The score ranges from 0 to 100.
Threshold unit: score (0–100).
Configuration
Section titled “Configuration”You can configure a threshold for each metric. The test fails when any measured value falls below the configured threshold.
Threshold changes and past runs
Section titled “Threshold changes and past runs”Threshold updates apply only to new runs.
Previous runs keep the thresholds and status they were evaluated with, so existing failed/error history entries do not change retroactively.
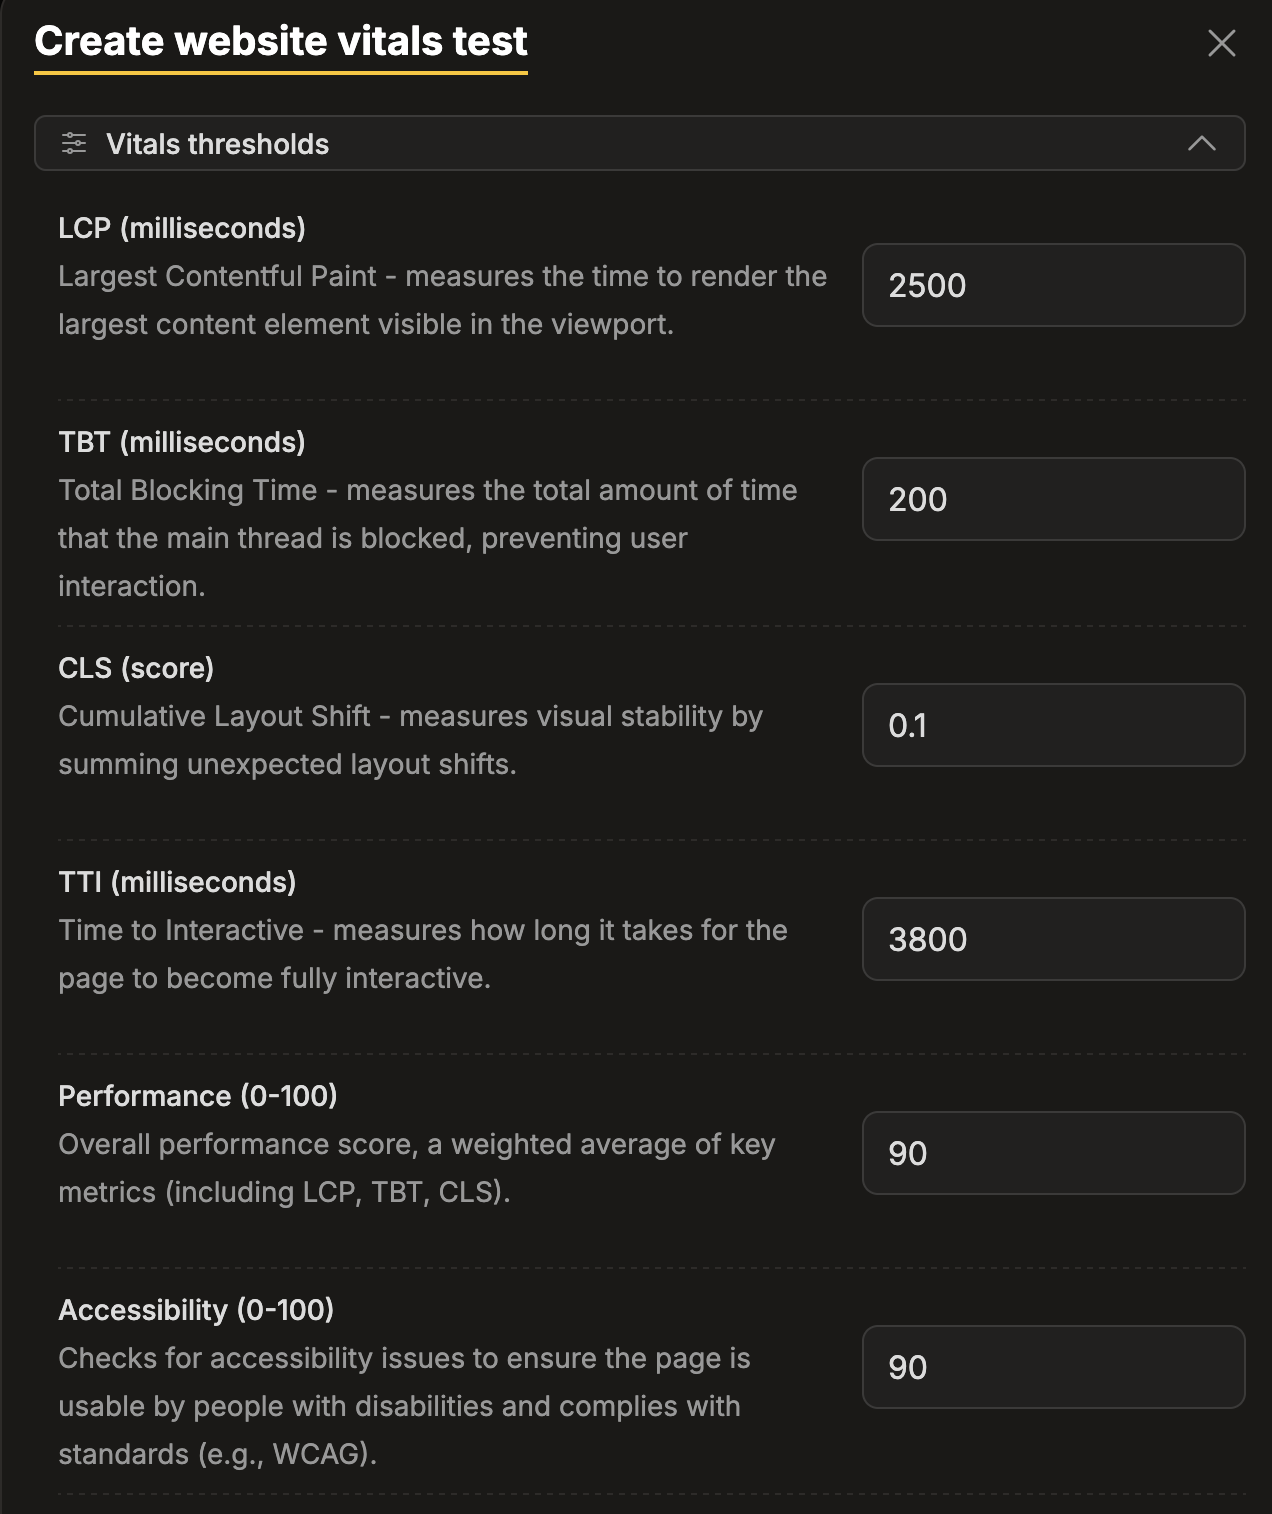
Configuration of Thresholds
Section titled “Configuration of Thresholds”Based on the current Website Vitals configuration screen, the default thresholds are:
| Metric | Threshold | Unit |
|---|---|---|
| LCP | 2500 | milliseconds |
| TBT | 200 | milliseconds |
| CLS | 0.1 | score |
| TTI | 3800 | milliseconds |
| Performance | 90 | score (0-100) |
| Accessibility | 90 | score (0-100) |
| Best Practices | 90 | score (0-100) |
| SEO | 90 | score (0-100) |
These values are the baseline pass criteria shown in test setup, and can be adjusted per test.
-
Navigate to Workspace using the left sidebar menu.
-
Click the Create button on the right side.
-
Select Website Vitals.
-
Enter the target URL.
-
Scroll down to the Advanced options section.
-
Expand the Vitals thresholds subsection.
-
Configure the thresholds for each metric (defaults shown):
- LCP (milliseconds)
- Default:
2500
- Default:
- TBT (milliseconds)
- Default:
200
- Default:
- CLS (score)
- Default:
0.1
- Default:
- TTI (milliseconds)
- Default:
3800
- Default:
- Performance (0–100)
- Default:
90
- Default:
- Accessibility (0–100)
- Default:
90
- Default:
- Best Practices (0–100)
- Default:
90
- Default:
- SEO (0–100)
- Default:
90
- Default:
- LCP (milliseconds)
-
Navigate to Workspace using the left sidebar menu.
-
Locate the test you want to modify.
-
Open the test settings using one of the following methods:
- On the overview page, click Edit next to the Options section.
- On any page, click the three-dot menu and select Edit test properties.
-
Scroll down to the Advanced options section.
-
Expand the Vitals thresholds subsection.
-
Update the thresholds for the metrics you want to change.
Reporting
Section titled “Reporting”The error messages
Section titled “The error messages”When any metric falls below its configured threshold, the test is marked as failed.
The reported message depends on how many metrics failed:
Single metric failure
Message format: The METRIC is below the threshold
Example: The LCP is below the threshold
Multiple metrics failure
Message format: Multiple parameters are below the threshold (METRIC1, METRIC2, …)
Example: Multiple parameters are below the threshold (LCP, performance)
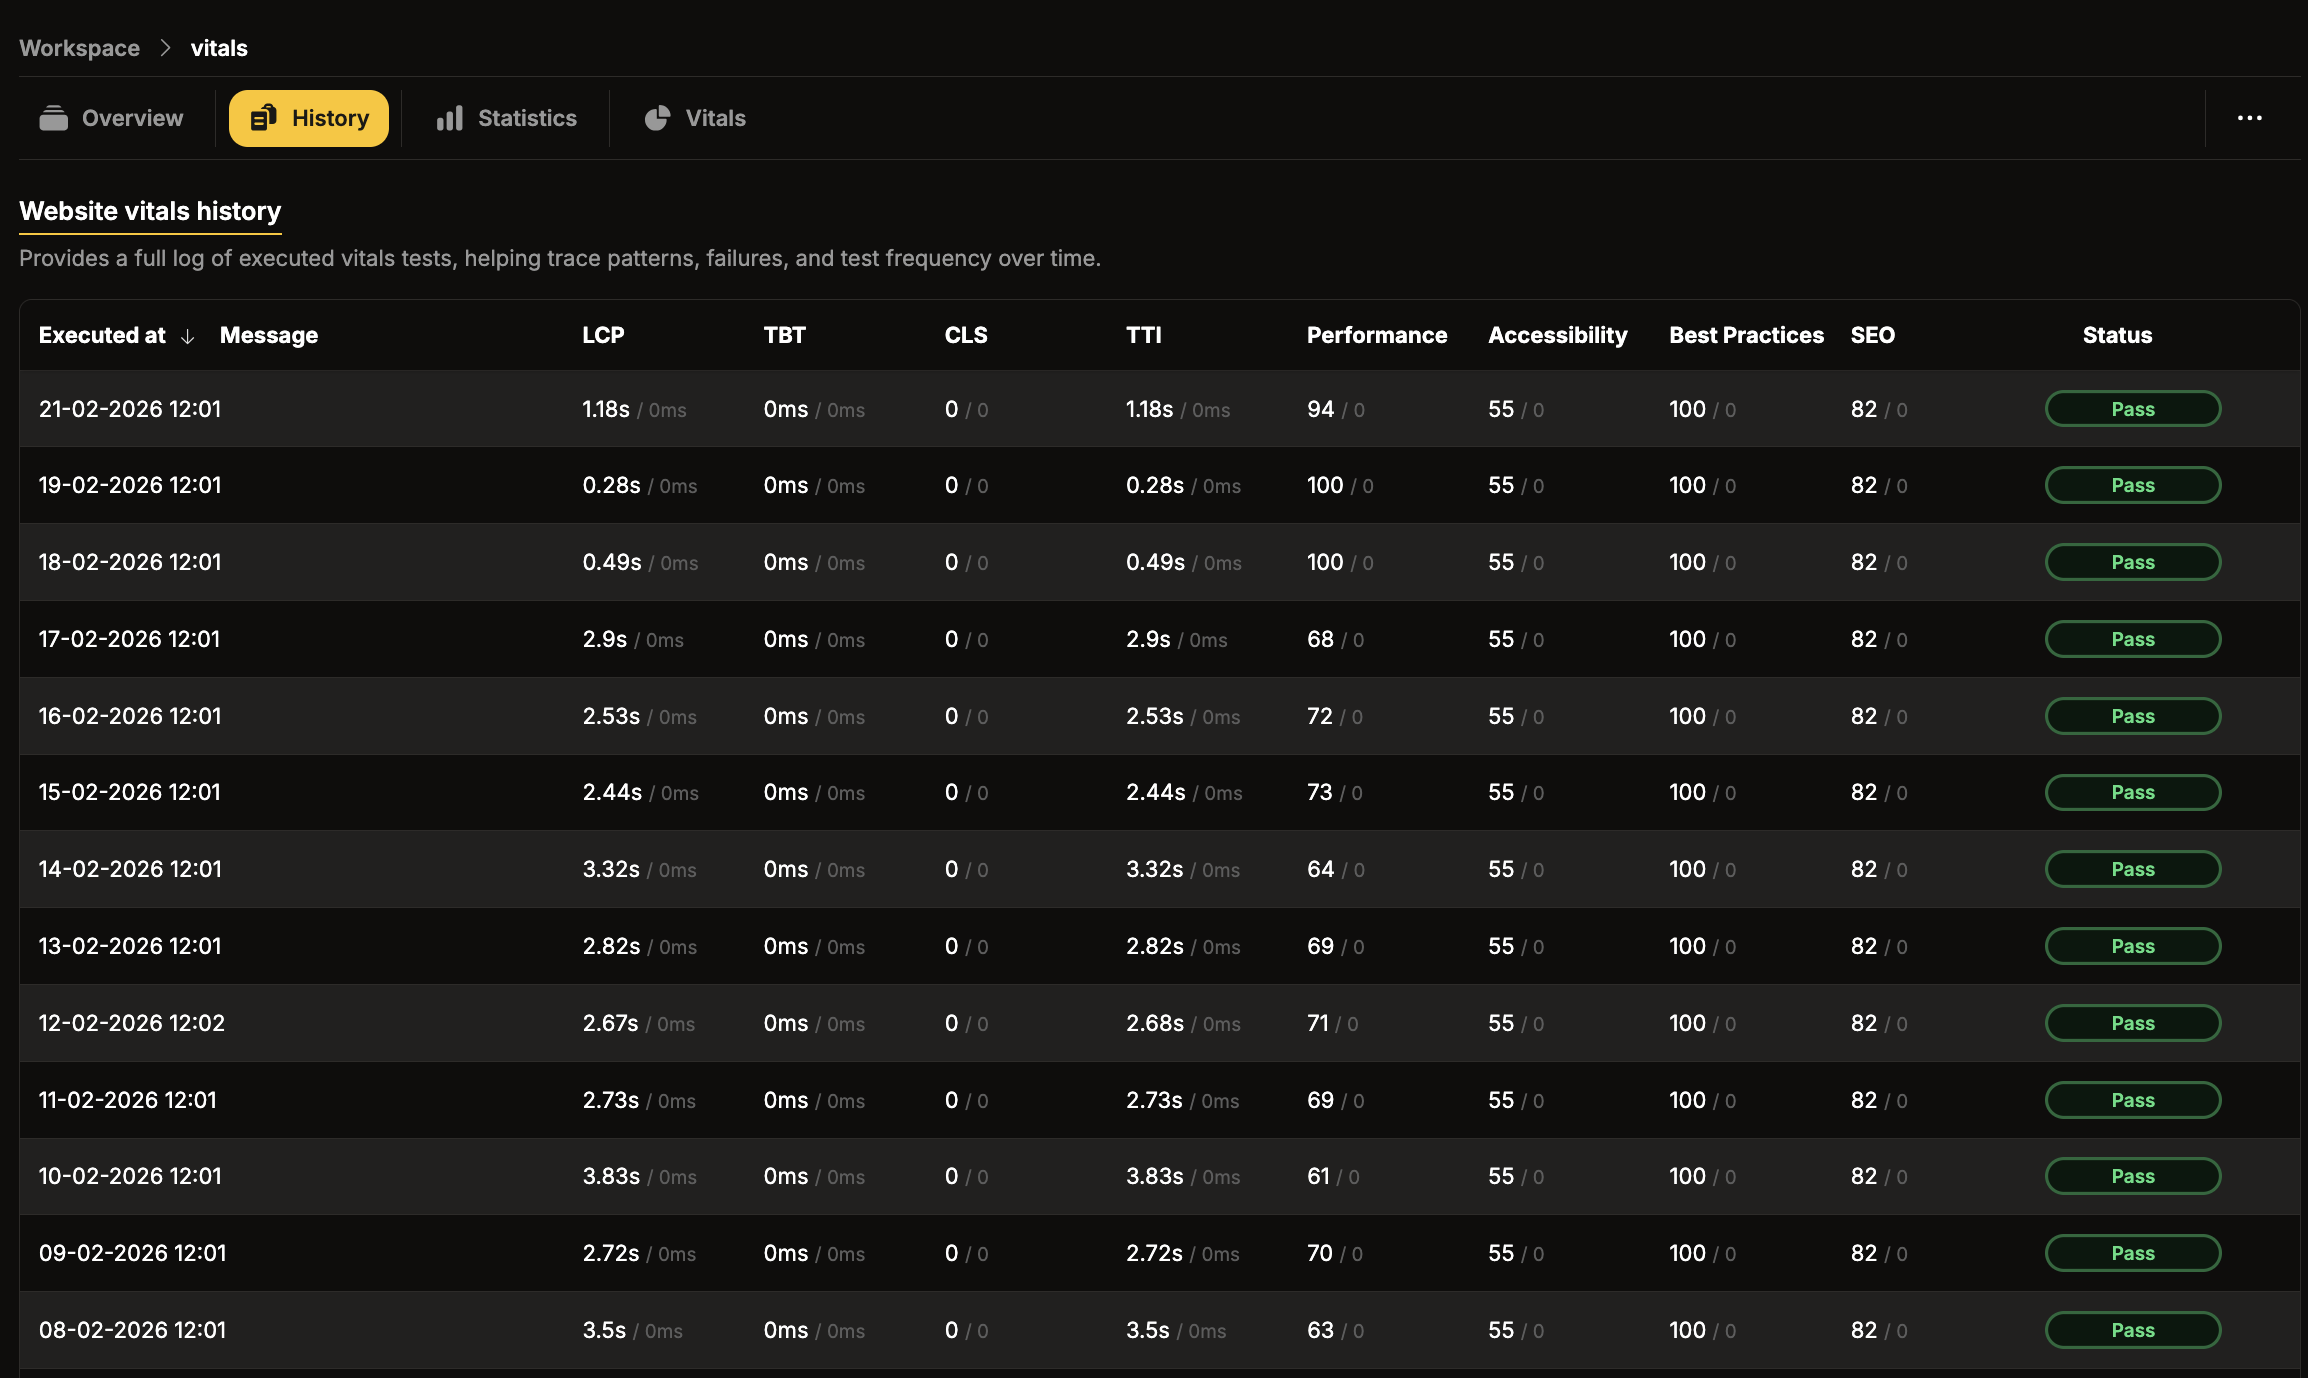
History tab
Section titled “History tab”The History tab is located in the top navigation bar of the test details view.
It provides a chronological log of every test execution, including:
- Status — whether the run passed or failed.
- Message — the error description when a failure occurs (see error messages above).
- Per-metric values — the measured value for each metric alongside the threshold that was configured at the time of the run.
Each row preserves the threshold that was active when the run executed. Even if you later change a threshold, the History tab still reflects the original criteria the run was evaluated against. Use this tab to trace regressions, identify recurring failures, and verify that threshold adjustments produce the expected results.
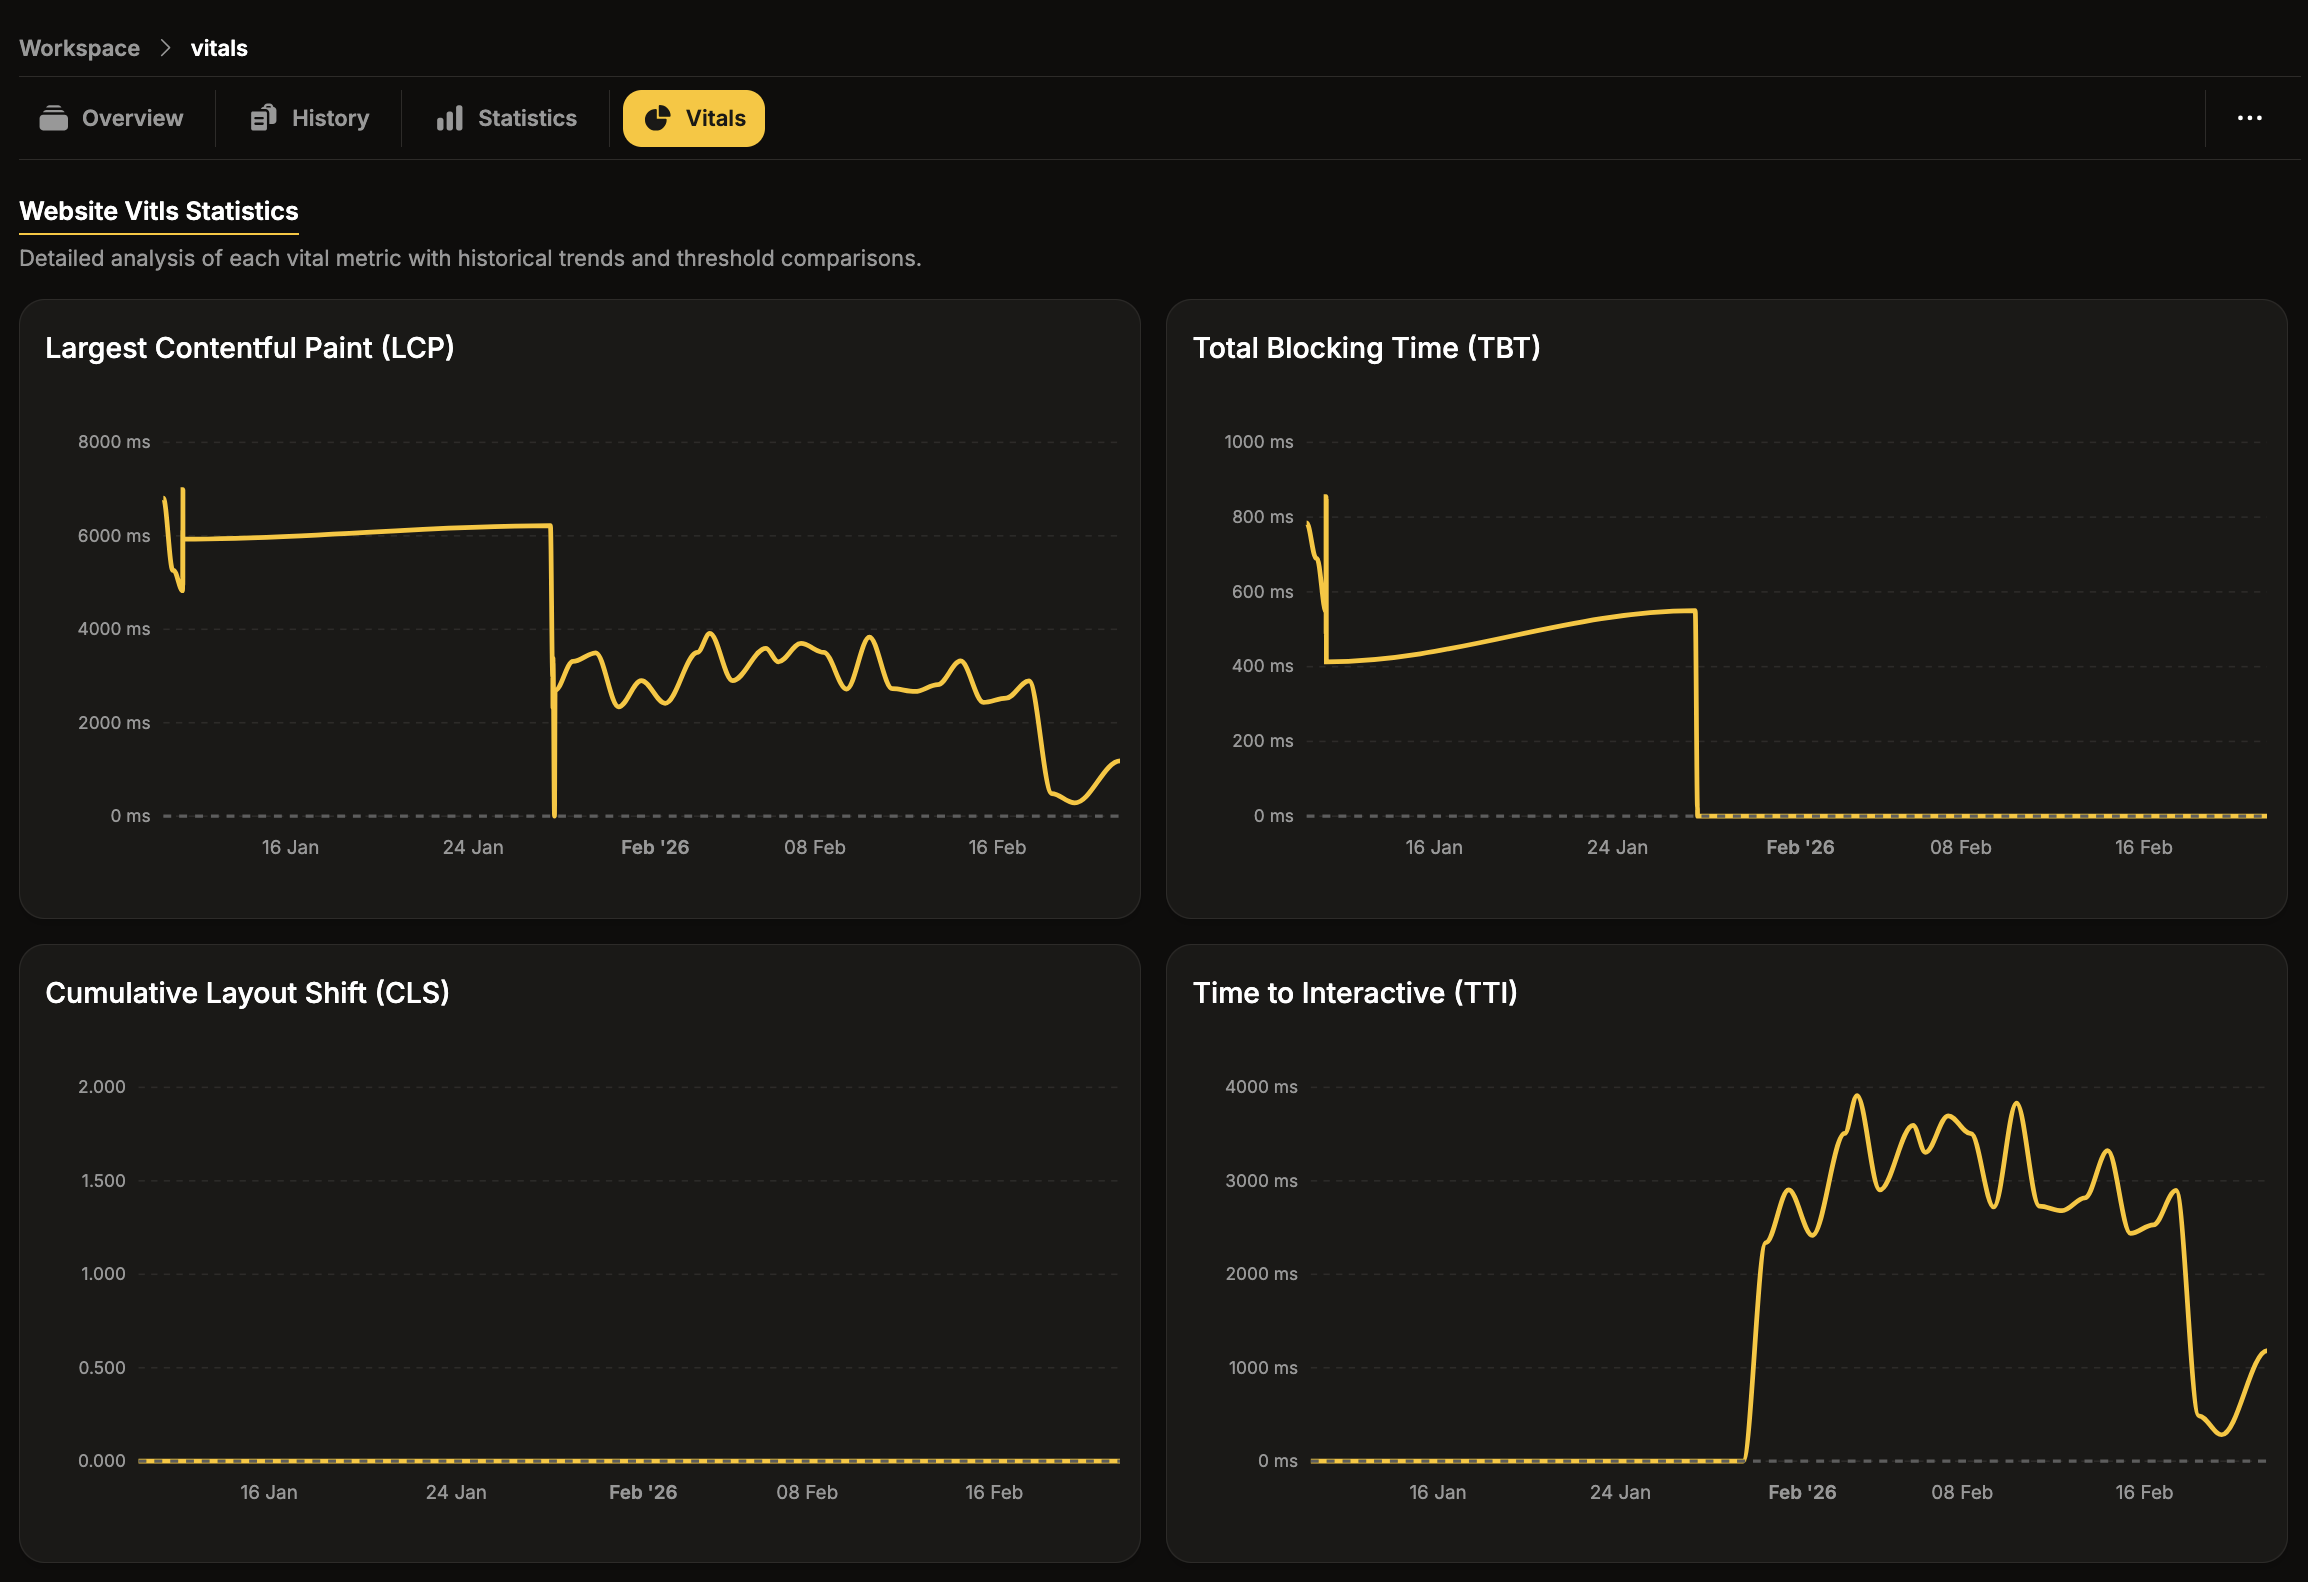
Vitals tab
Section titled “Vitals tab”The Vitals tab is located in the top navigation bar of the test details view.
It displays a trend chart for each metric, plotting measured values over time. Each chart contains:
- Yellow line — the historic measured value.
- Gray line — the current configured threshold.
Comparing these two lines helps identify performance trends and determine whether the current threshold is appropriate.