Performance Audit
Introduction
Section titled “Introduction”Performance Audit helps you monitor loading times and network activity for your website scenario runs. It gives you visibility into endpoint timings, response sizes, status codes, and waterfall execution.
Performance Audit in TestCLIX is informational. It is designed for investigation and optimization, not for pass/fail enforcement.
How It Works
Section titled “How It Works”When Audit performance is enabled, TestCLIX collects network request details during scenario execution and stores them as a HAR file.
You can review this data in the Performance tab of a test and export the HAR file for deeper analysis.
Configuration
Section titled “Configuration”-
Navigate to Workspace using the left sidebar menu.
-
Click the Create button on the right side.
-
Select Web Scenario.
-
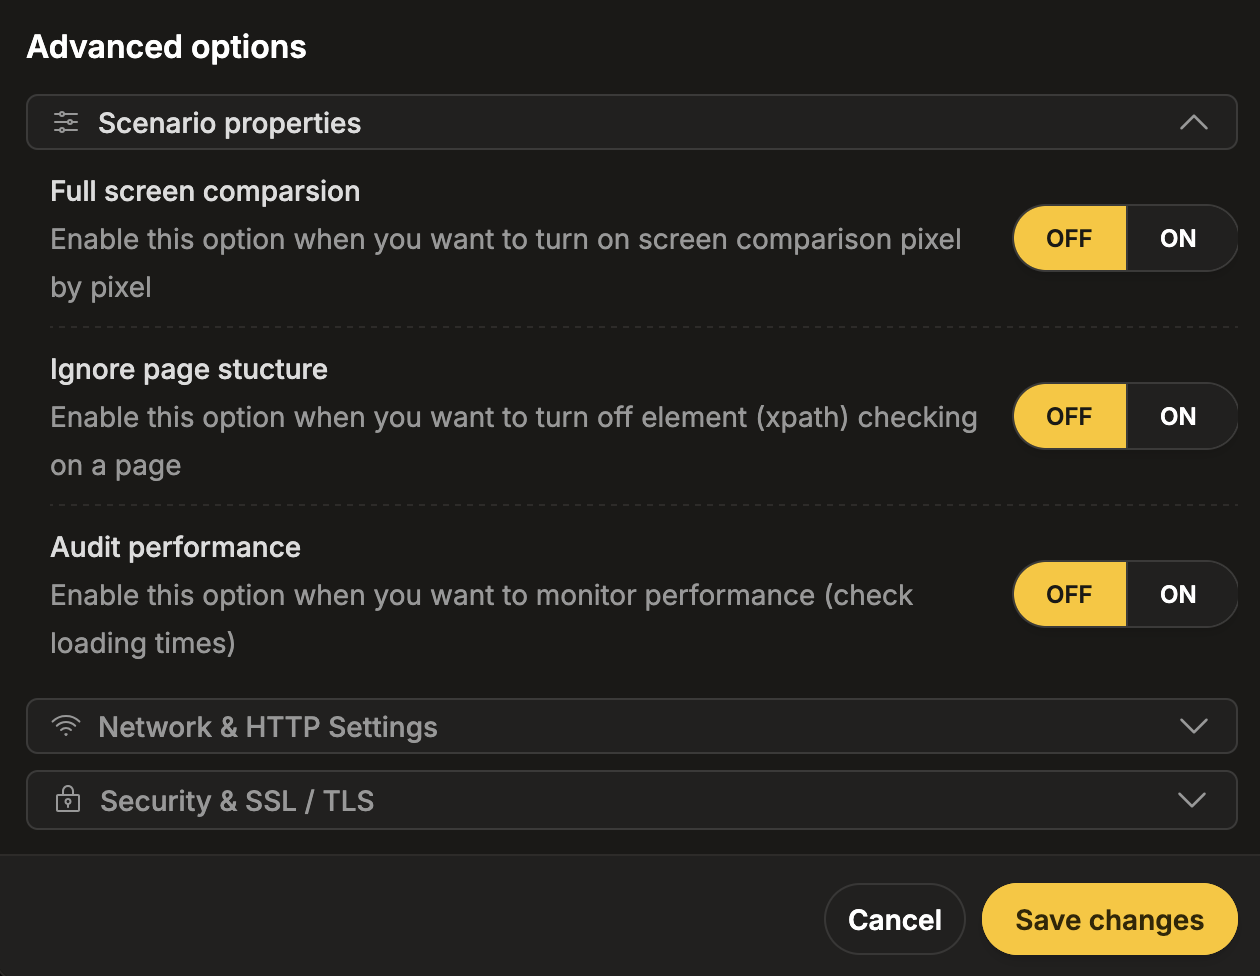
Scroll down to the Advanced options section.
-
Expand the Scenario properties subsection.
-
Set Audit performance to ON.
-
Navigate to Workspace using the left sidebar menu.
-
Locate the test you want to modify.
-
Open the test settings using one of the following methods:
- On the overview page, click Edit next to the Options section.
- On any page, click the three-dot menu and select Edit scenario properties.
-
Scroll down to the Advanced options section.
-
Expand the Scenario properties subsection.
-
Set Audit performance to ON.
Reporting
Section titled “Reporting”To access performance data and HAR exports:
-
Navigate to Workspace using the left sidebar menu.
-
Open the test session.
-
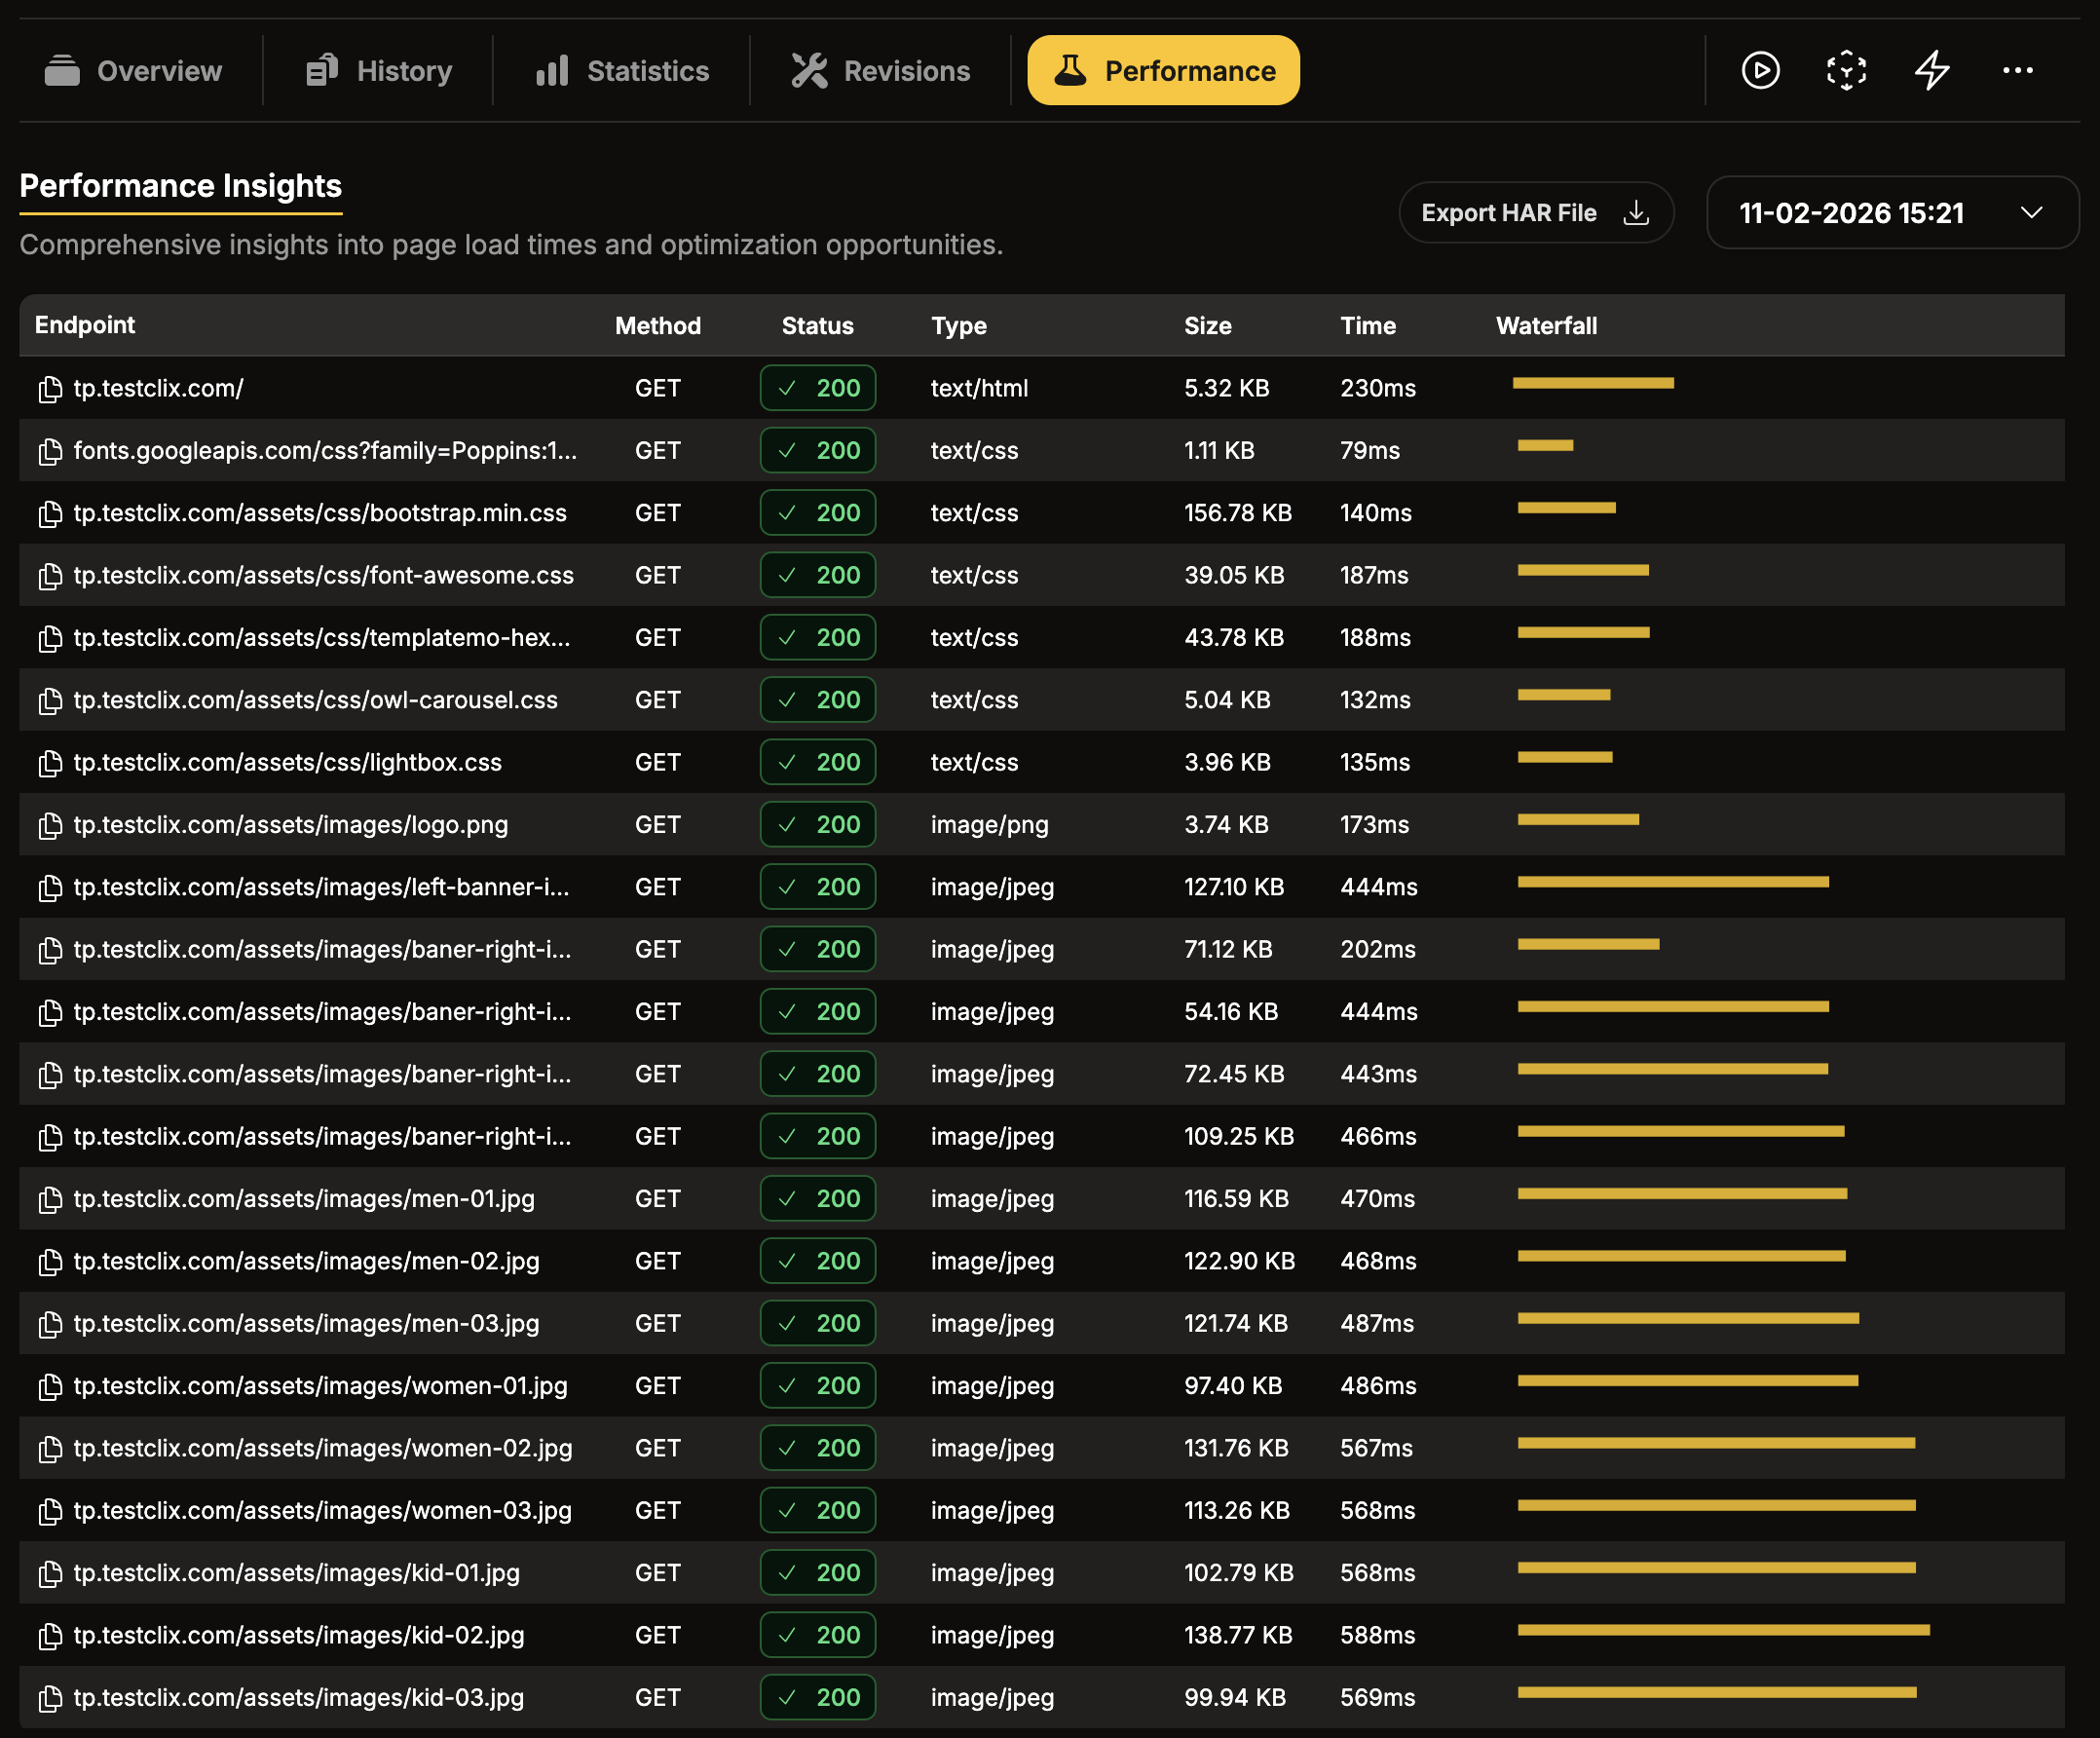
At the top navigation in the test view, select Performance.
-
Review performance insights such as endpoint, method, status, type, size, time, and waterfall.
-
Click Export HAR File to download the HAR file.
HAR File Retention
Section titled “HAR File Retention”HAR files are automatically removed after 30 days.
Inspect HAR in Browser
Section titled “Inspect HAR in Browser”After downloading a HAR file, you can inspect it in your browser.
-
Open your browser Developer Tools.
-
Go to the Network tab.
-
Import the HAR file:
- Drag and drop the
.harfile into the Network panel, or - Use the import option available in your browser Network tools.
- Drag and drop the
-
Analyze requests, timing phases, payload sizes, and waterfall order.