

Performance
Introduction
Section titled “Introduction”The Performance feature in Website Availability measures the HTTP response time of every successful check and shows how it changes over time.
It helps you answer questions such as:
- Is my website getting slower over time?
- How much headroom is left before responses hit the configured request timeout?
- Did a deployment, migration, or infrastructure change affect response time?
Performance in TestCLIX Website Availability is informational. It is designed for observation and investigation, not for pass/fail enforcement.
How It Works
Section titled “How It Works”When Response time is enabled, TestCLIX measures the total duration of each availability check — from the moment the request is started until the response is fully received.
The measured time covers the whole request lifecycle:
- DNS resolution
- TCP connection
- TLS handshake
- waiting for the server response
- downloading the response body
The result is stored as a single value in milliseconds for each check run.
Response time is recorded only for successful checks. Failed checks (wrong status code, SSL problems, timeouts, connection errors) do not produce a data point, so the chart always reflects how fast your website responds when it is healthy.
Configuration
Section titled “Configuration”Response time measurement is disabled by default and can be enabled per test.
-
Navigate to Workspace using the left sidebar menu.
-
Click the Create button on the right side.
-
Select Website Availability.
-
Scroll down to the Advanced options section.
-
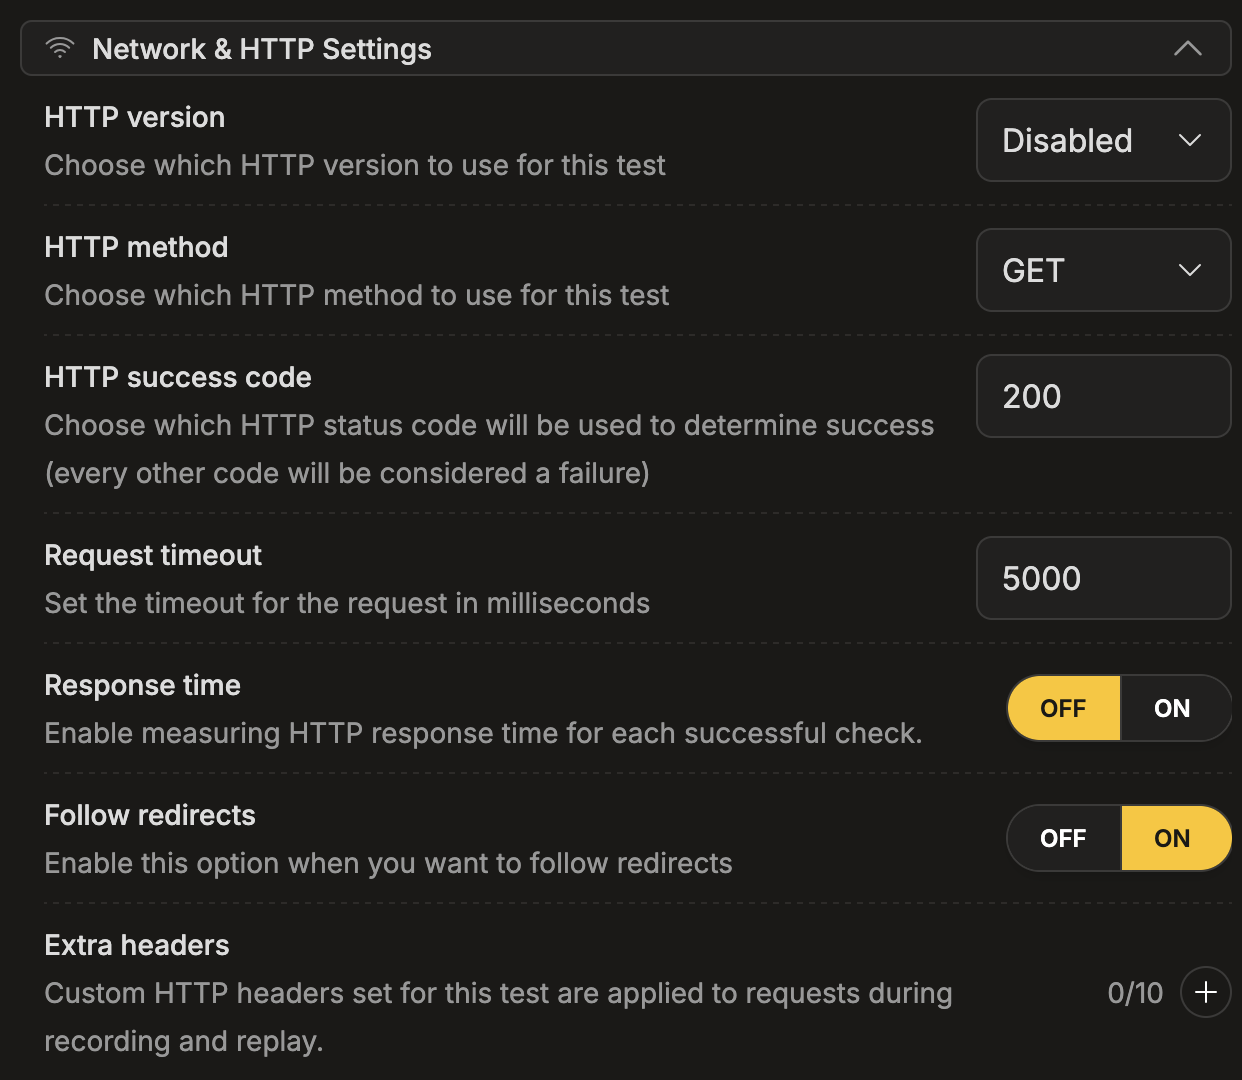
Expand the Network & HTTP Settings subsection.
-
Set Response time to ON.
-
Navigate to Workspace using the left sidebar menu.
-
Locate the test you want to modify.
-
Open the test settings using one of the following methods:
- On the overview page, click Edit next to the Options section.
- On any page, click the three-dot menu and select Edit test properties.
-
Scroll down to the Advanced options section.
-
Expand the Network & HTTP Settings subsection.
-
Set Response time to ON.
Reporting
Section titled “Reporting”Performance tab
Section titled “Performance tab”To review response time trends:
-
Navigate to Workspace using the left sidebar menu.
-
Open the availability test.
-
At the top navigation in the test view, select Performance.
-
Review the Response time chart.
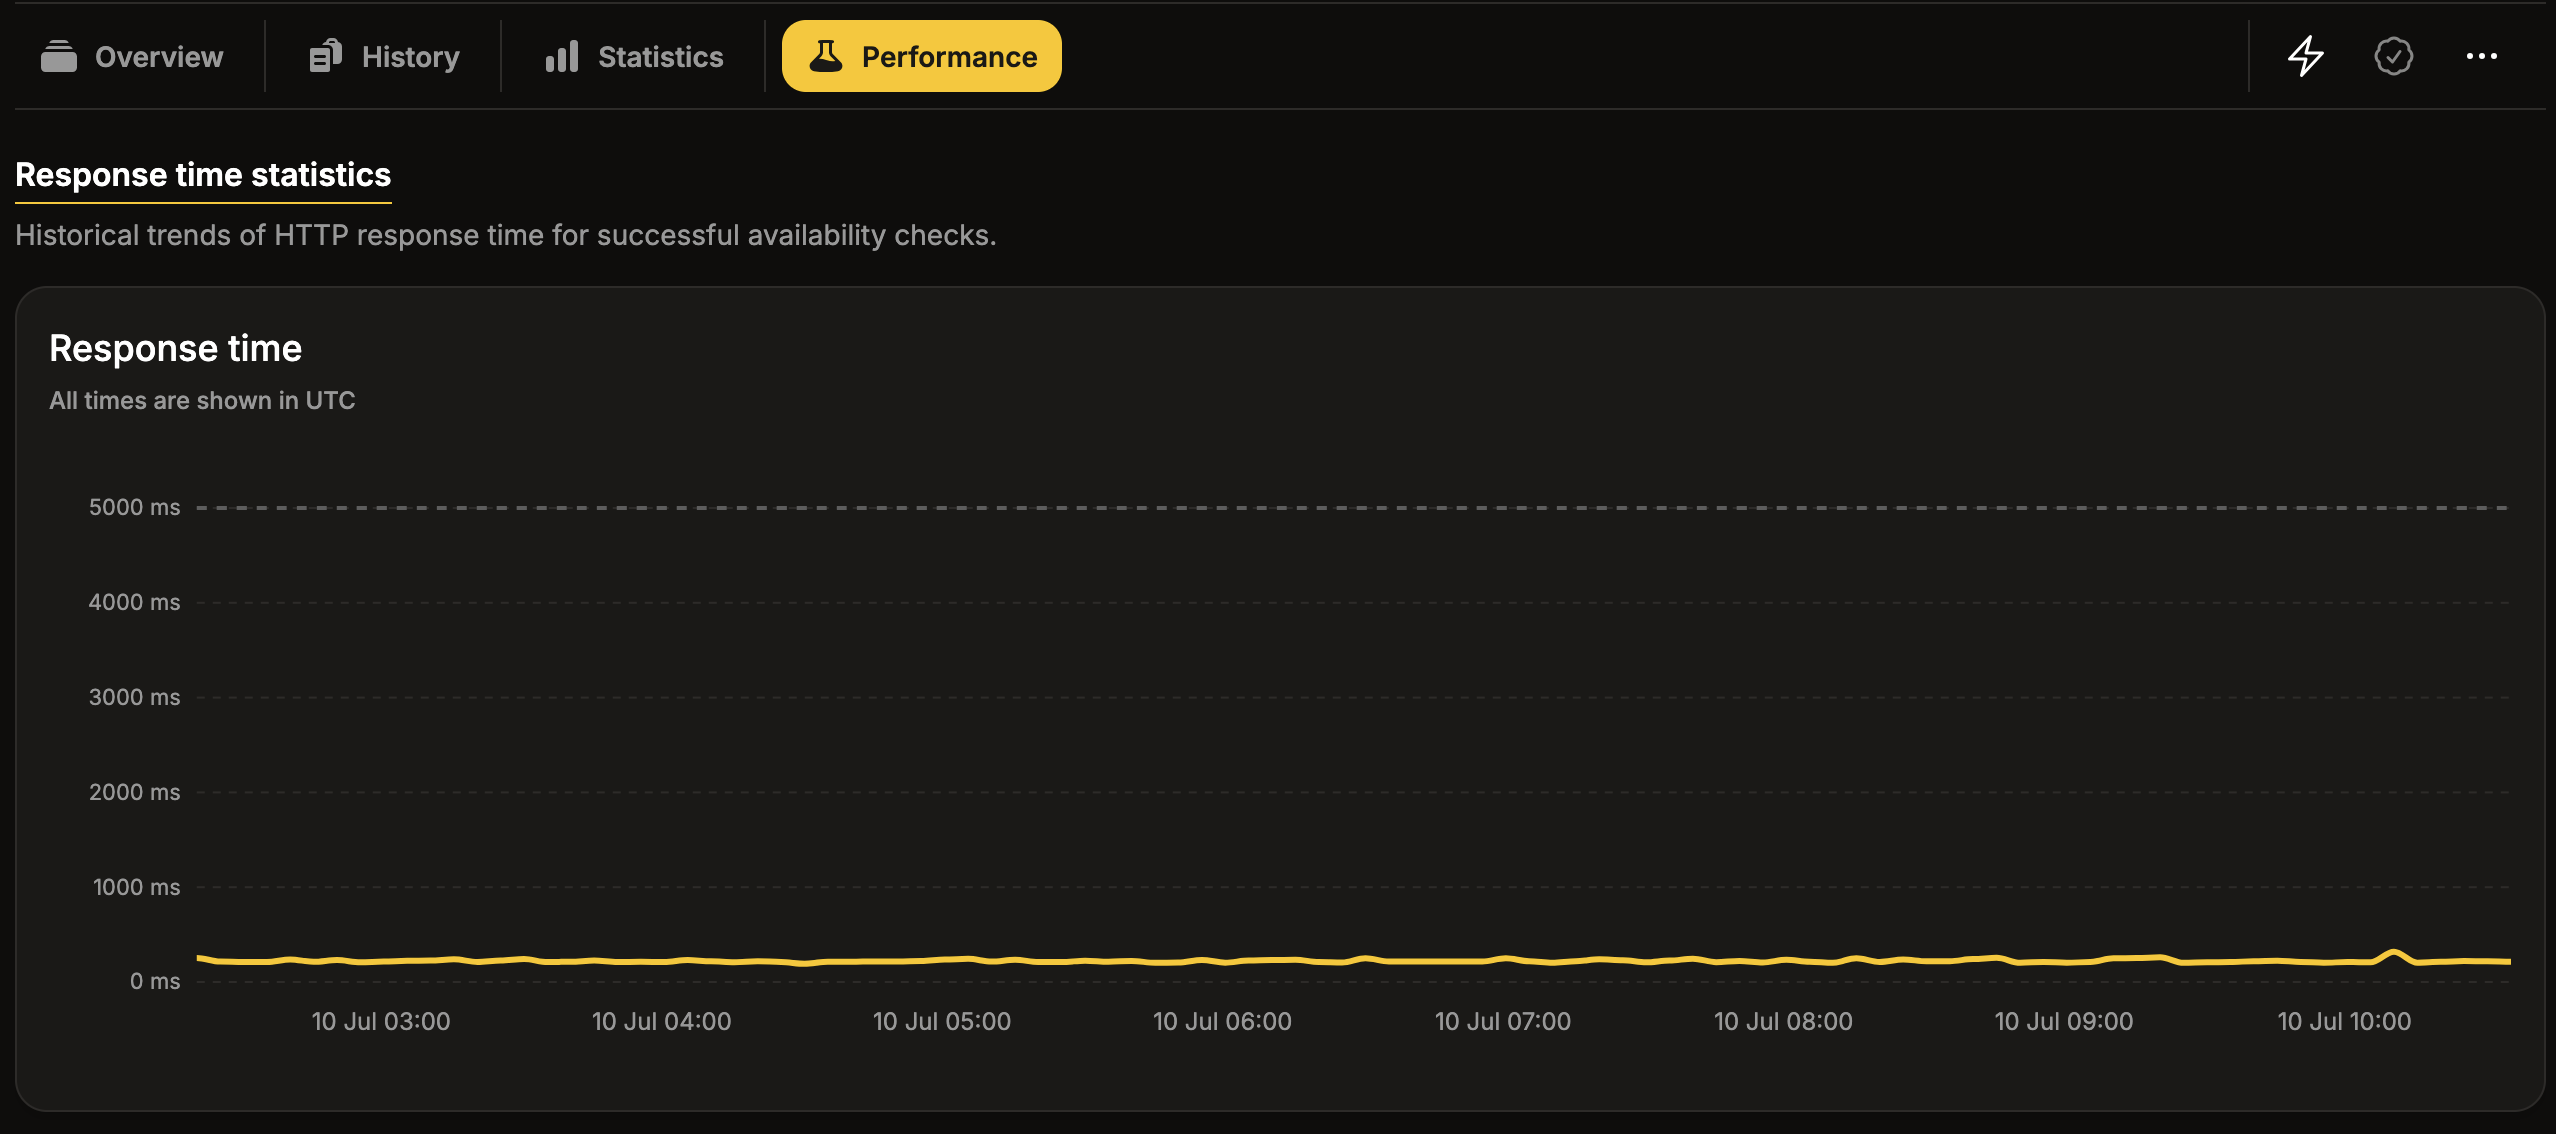
The chart contains two lines:
- Yellow line — the measured response time of each successful check, in milliseconds.
- Gray dashed line — the configured Request timeout (default
5000ms).
Comparing the two lines shows how much headroom your website has before checks start failing due to timeouts. All times on the chart are shown in UTC.
If the chart is empty, the page explains why:
- Response time measurement is disabled — enable the Response time option in the test settings to start collecting data (see Configuration above).
- No response time data yet — the option is enabled, but no successful check has run yet. Run a manual check or wait for the scheduler to generate data.
History tab
Section titled “History tab”The History tab also shows the measured Response time for each individual run, next to its status and message. Use it to inspect the exact value of a specific check rather than the overall trend.
Beyond Response Time
Section titled “Beyond Response Time”Response time is a single end-to-end measurement of the HTTP check. If you need browser-level performance quality metrics — such as Largest Contentful Paint, layout stability, or Lighthouse scores — use Website Vitals.
For a full network waterfall of a browser journey, use the Performance Audit in Website Scenario.